Mobile Game Ideas: 15 Tips to Come up with a Gaming App
About 2.2 billion people worldwide play games on their mobile phones. This is about 28% of the total population in the World. Mobile games, when used in leisure time, are good energy boosters and improve your brain training, logical and problem-solving skills.
Augmented Reality, Artificial Intelligence, and other advanced technologies have contributed to the seamless experience of mobile gaming, creating more demand and downloads for them.
Since the mobile apps have gained popularity in the market, the games have flourished their presence across the world with the help of mobile gaming apps.
Now, we shall discuss in detail the 15 important tips you should follow to develop the best mobile gaming app.
1. Try out different games

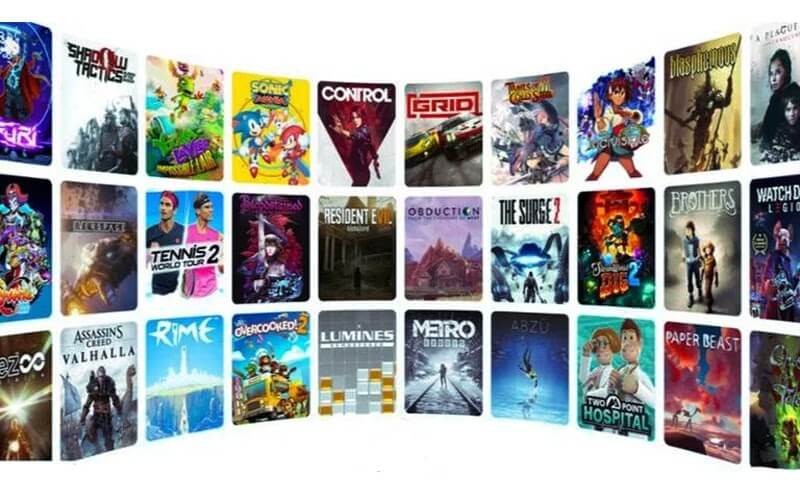
Various games are built with different surroundings, stories, values, and experiences. Develop a habit of playing various types of games to know the differences and get inspired from them. You can get an idea about the strategies, unique features, and hook elements that keep the game interesting till the end.
Also, try to understand the other elements like the interface, the tone, and the other exciting features making the game interesting to you.
There are also some games adopting the trends and making similar games to entertain the audience. For example, the Fruit Ninja mobile game saw the rise of similar games such as Cut the Rope, Fruit Slice, Fruit Slash, Cut the Fruit, and Fruit Blast as alternatives.
2. Get into various gaming communities
There are various communities available across social media and online, that discuss trending games, hot debates, and sharing information about the games. Normally, multiplayer games are trending in the communities, and you get chances to interact with other developers and game addicts.
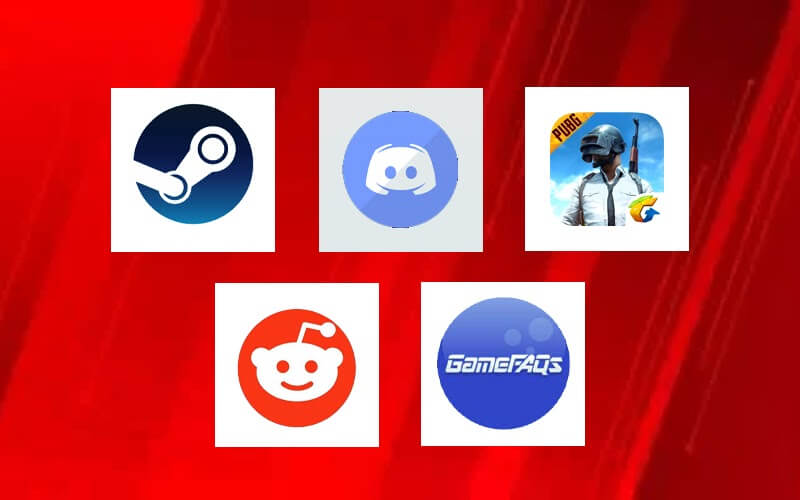
Top gaming communities like Steam, Discord, PUBG mobile, Reddit, and Game FAQs are the best places where you can peep into, collect, and share information among the gamers and developers.
3. Get inspired from your surroundings
People tend to be more impressed with games designed and developed with visuals that replicate the real world. Get stimulated by the surroundings and try to implement them in the games, so that it maintains a spark of excitement and interest among the gamers.
Some games like Simcity and the GTA series have been successful in building interest among the audience with the use of realistic experiences.
4. Stream your Demo Game
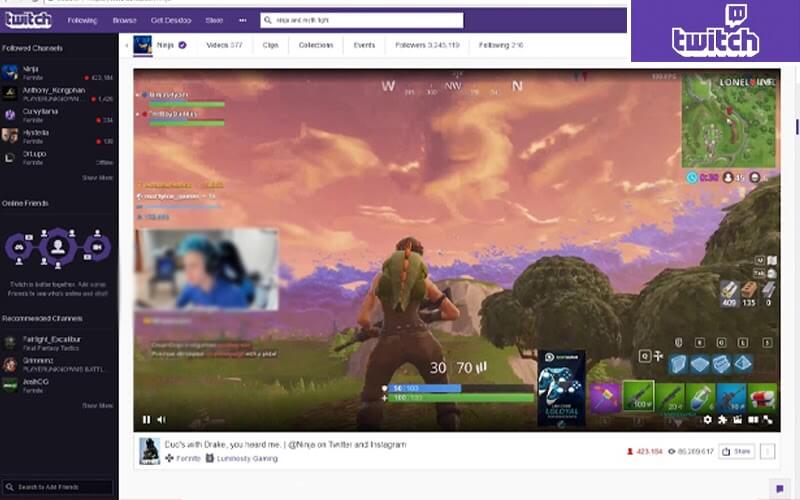
Platforms like Twitch, Discord, and Youtube help you to stream games and invite gamers to watch the show. You may try out using this technique to play a sample or demo version of the game, and analyze how people react to it. These platforms have a lot of potential visitors who particularly spend time only trying new games and watching live game streaming.
Also, you can get motivation from the various developers, who introduce and market their mobile games and initiate live streaming to induce interest in the minds of gamers.
5. Stay updated with the advanced gaming trends
Track and monitor the top chart and popular mobile games and analyze the categories and genre to which they belong. Search for popular games and why people love them. There can be some common elements people list about those games in their reviews, which can be adapted to your games too.
For example, PUBG mobile games are the No.1 favorite and most downloaded game among gamers. It generated over $2.6 billion in revenue in the year 2020, which is a huge success.
Certain tools can help you with app analytics like UXCam and AppsFlyer, which let you observe and derive inferences about the trending games and ideas on them.
6. Follow SCAMPER technique
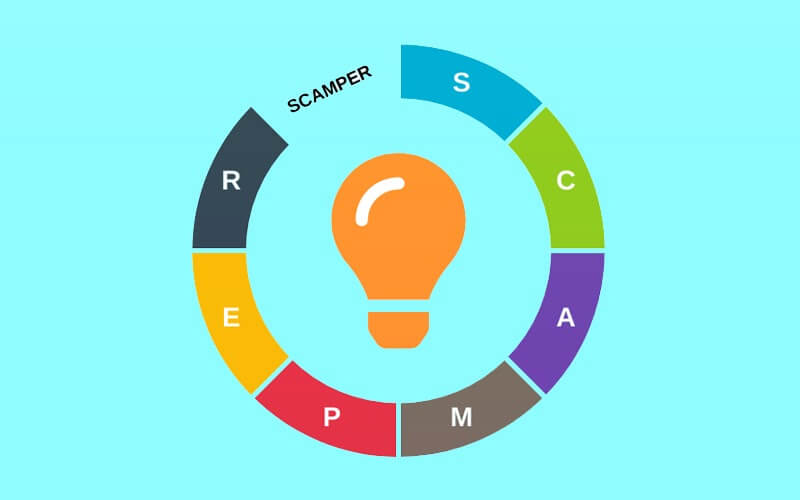
The App Store witnessed Color Switch as one of the fastest games played in about 150+ countries, with 50 million and above downloads. They had adopted the SCAMPER method to develop their mobile games, which has been an inspiration to several game developers across the globe.
SCAMPER means Substitute, Combine, Adapt, Modify, Purpose, Eliminate, and Rearrange. Adopt these ideas to develop a better gaming experience for your audience.
7. Collect opinions and surveys from the audience
This is one of the most practical and effective methods of getting genuine inputs for your mobile game app development. You may use forms, surveys, or even questionnaires and get valuable suggestions and feedback from the audience.
Include questions where the people can explain the type of game they love, their choices, and interests to play.
8. Develop ideas from Movies, Stories, and Books

Games become more interesting when they are developed around the storyline of a movie, story, or book. This can grab more attention and create a desire among the audience to try the game.
Fast and Furious, Starwars- Galaxy of Heroes, Jungle Book, etc. have been successful mobile games developed around the stories and movies. This can create more interest among the youngsters and the children, and create an unforgettable experience, making your games successful.
9. Be Specific About the Platform You Choose
Before launching the mobile gaming app, be sure about the platforms you wish to release the games. Android and iOS have a wide variety of games that are mostly demanded by mobile users. However, it is highly recommended to plan the launch on both these platforms. About 57% of the overall share of the gaming revenue worldwide is contributed by mobile gaming. This way, you can get an increased audience from both types of devices, and develop a perfect fan base for your games.
10. Learn from Leading Game Publishers
According to Statista, the gaming market is conquered by the leading mobile game publishers like King, Coinmaster, Bridge Race, and Roblox. They have long and interesting tales to say. Follow them and let those unique strategies they adopt be your guiding principles to develop the games.
You can learn a lot about the facts like monetization, PR, community management, social media management, marketing and advertising, app store optimization, and so on.
11. Make Realistic Stories

Many games have excellent stories. And that’s what makes them stand out too. The games like The Walking Dead, The Room, Tomb Raider, Temple run, and many others have been interesting with an excellent storyline. Being realistic and having stories to say, are highly engaging factors when the audience or gamers are concerned. This is the best part of the user experience, and the highly sensitive part at the same time, which needs to be well focused before crafting stories for the games.
12. Have the Best Background Music
Be specific with the selection of the music for your mobile game. The choice of music should be soothing enough that engages the players while being in the game. You can find royalty-free tracks that fit these requirements online, saving you money on licensing fees. The games like Alto’s Adventure, and Owlboy have great background music that keeps the gamers engaged while playing the game. Just like the visuals, sound also plays an important role in maintaining the mood and interest of the audience.
13. Take care of UI/ UX
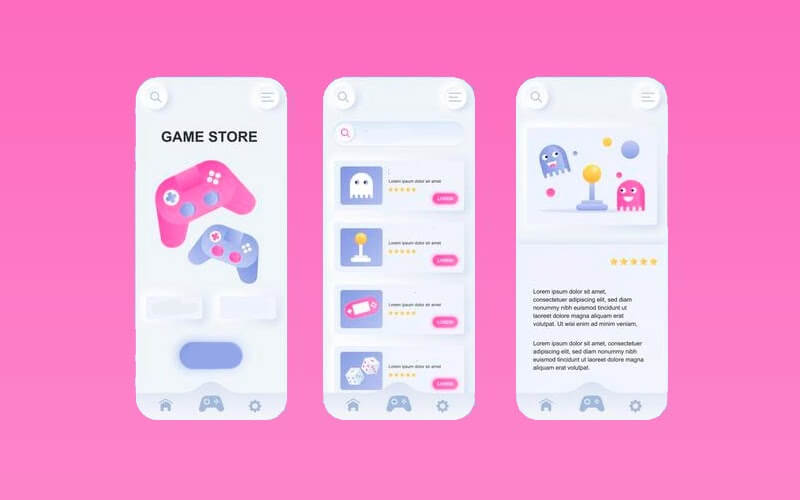
The mobile games are designed to give endless satisfaction and entertainment to the audience. The game genre also matters while considering the user experience. The preferences of the gamers vary. Whether it be single-player, multiplayer, shooter level, fantasy, action, adventure, puzzle, or other casual games, they should create fascination among the gamers. With the perfect blend of UI/ UX features, the games like Angry Birds, and Candy Crush Saga, have made enough buzz in the mobile gaming sector.
Don’t use too many features to disturb the users. Also, make the interface design easy and clear. Also, let the UI be easy to access and incorporate the functionality according to users’ requirements.
14. Monetization Policy
It is not only about developing the apps but also about the ways to earn money with the apps you develop.
There are various types of monetization methods by which game developers can generate revenue.
- Ad revenue: The player can download the app for free, and the developer gets paid whenever the player clicks or views the ads
- In-app purchase: In this model, the user downloads the free base game version and then purchases the additional features to boost the game.
For example, in a PUBG game, the player buys weapons, skins, etc. to boost the gaming experience.
- Premium purchase: In this model, the users can get the demo game for free and then purchase the premium version to unlock the full version after It.
- One-time purchase: In this model, the user can buy the whole game in one go and enjoy all the benefits out of it.
If you run out of budget, or you are a startup finding it difficult to make investments on a mobile gaming app, there are also crowdfunding platforms like Kickstarter. The game addicts, developers, and well-wishers in the platform are ready to provide funds to the aspirants and game creators once they find the project genuine and interesting.
15. Read game news and reviews

It is important to develop an awareness and keep yourself updated with the news and game reviews across various online platforms exclusively allocated for such information. The platforms like Pocketgamer.biz, pcgamer.com are the exclusive places where you come across A to Z information regarding games and their discussions.
Keep yourself updated with the trending topics and have them included in your app development plan and document.
Bonus Tip: Use the appropriate technology
For android games, the common programming language used is Java. While for iOS, this is Swift. To build and develop Android Apps you may use the Android Studio whereas you can use Xcode for the iOS apps.
Be clear about the technology, platform, graphics you use. For every game, a 2D design is required. However, there are also many game apps built using 3D graphic design too.
For gaming graphics, you may also adopt tools like Photoshop, Illustrator, and Inkscape. There are also 3D modeling programs such as Blender 3D, Maya, etc.
Apart from them, you can develop and record the audio, connect a mic and other devices to a computer with an excellent DAW. (Digital Audio Workstation). The tools like FL Studio, Cubase, and Adobe Audition are some examples.
Conclusion
The Angry Birds game you play now was Rovio then, and it failed 51 attempts before rising into a renowned and widely accepted game.
The gaming apps usually fail due to their inability for monetization, lack of budget planning for development, heaviness or complications involved in the gaming process, lack of excitement, and user-friendliness in the game.
However, keen experiments, effective learning, prototypes, and including the right strategies for mobile app development, can help you to improve the gaming experience and thereby revenue.
Also, if you have good mobile game development ideas, then you may kick off the game development process by considering all the above tips to make it hit the target.